1 Overview
Lets disscuss How to detect Kernel Memory leak
2 Basic Knowledge
2.1 Memory Leak
In computer science, occurs when a computer program acquires memory but fails to release it back to the operating system.
In object-oriented programming, a memory leak may happen when an object is stored in memory but cannot be accessed by the running code.
A memory leak has symptoms similar to a number of other problems and generally can only be diagnosed by a programmer with access to the program source code.
2.1 Linux memory management
alloc in need, and free in no need
based on page frame management
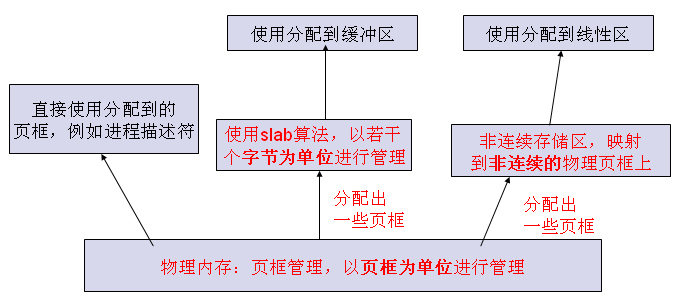
- alloc big space: alloc_pages/free_page:buddy algorithm
- alloc data struct::kmalloc/kfree:slab algorithm
- Non continuous memory area:Vmalloc/Vfree:
2.2 Memory mode for C++ and Java
- local variable: saved in Stack(fast for access)
- Object (new) : saved in Heap
- Object reference (new) : saved in Stack(fast for access)

3 How does Memory Leak come
3.1 memory leaks both in userspace applications
3.1.1 No Referenced Memory
(C++ only) new->delete, malloc()->free()

(Java ) No free or delete needed. garbage collection(GC)
3.1.2 No free Objects/Pointers (C++ and Java)
 String[] sa = new String[9999999];
 for (int i = 0; i < 9999999; i++){
   String s = new String(“adfasdfadsfas…adfasdfa”); //a 1MB size string…
   sa[i] = s;
 }
3.1.3 No Limited Storage (C++ and Java)
Vector, hashtable, hashmap, map, arraylist and String StringBuffer
3.2 kernel memory leaks in linux kernel
allocations and free
- kmalloc/kzalloc ->kfree
- kzalloc== kmalloc() + memset()
- vmalloc ->Vfree
- per_cpu
- kmem_cache_alloc->kmem_cache_free
4 How to detect Memory Leak
We needs to detect memory leaks both in userspace applications and linux kernel.
4.1 memory leaks both in userspace applications
Tools
- Valgrind
- Qview
- Purify -Usually for C Code
- Heap Analyzer -For Java Code
- Java Dump
4.2 kernel memory leaks in linux kernel
There is already a mechanism in the Linux kernel aims to detect to memory leaks That is kmemleak
Let`s talk more about this.
5 kmemleak
Kmemleak provides a way of detecting possible kernel memory leaks in linux kernel , in a way similar to a tracing garbage collector.
With the difference that the orphan objects are not freed but only reported via /sys/kernel/debug/kmemleak.
A similar method is used by the Valgrind tool (memcheck --leak-check) to detect the memory leaks in user-space applications.
The challenging part is the leaks should be detected in a runnning kernel.
- The main drawback is the reduced performance of memory allocation and freeing.
This tool is intended for debugging purposes where the performance might not be the most important requirement. To avoid other penalties, the memory scanning is only performed when the /sys/kernel/debug/kmemleak file is read.
- The tool can report false positives.
These are cases where an allocated block doesn't need to be freed (some cases in the init_call functions),the pointer is calculated by other methods than the usual container_of macro or the pointer is stored in a location not scanned by kmemleak.
5.1 Mechanism
5.2.1 Allocation
The memory allocations via kmalloc, vmalloc, kmem_cache_alloc and friends are traced and the pointers, together with additional information like size and stack trace, are stored in a prio search tree.
5.1.2 free
The corresponding freeing function calls are tracked and the pointers removed from the kmemleak data structures.
5.1.3 Mechanism
An allocated block of memory is considered orphan if no pointer to its start address or to any location inside the block can be found by scanning the memory (including saved registers).
This means that there might be no way for the kernel to pass the address of the allocated block to a freeing function and therefore the block is considered a memory leak.
5.1.4 The scanning algorithm steps:
mark all objects as white (remaining white objects will later be considered orphan)
A big list is created holding every outstanding memory allocation in the system. This list is called the "white" list; everything on it is considered to be a possible memory leak.
scan the memory starting with the data section and stacks, checking the values against the addresses stored in the prio search tree. If a pointer to a white object is found, the object is added to the gray list
Various parts of memory are scanned for pointers which match the allocated blocks. Every time such a pointer is found, the block is moved to the "gray" list of memory which is still reachable, and thus not leaked.
The initial scan includes
   - the kernel's static data areas,
   - each process's kernel stack,
   - each processor's per-CPU variable data area.
scan the gray objects for matching addresses (some white objects can become gray and added at the end of the gray list) until the gray set is finished
The first scan finds all memory referenced directly from static memory, but kernel data structures are more complicated than that.
So, each block which has been put onto the gray list is scanned as well. Most of these blocks will be structures allocated from a slab cache, and they may contain pointers to other structures. So each block is queried, paying attention to that block's remembered size.
Any pointers found within the block are moved over to the gray list, and scanned in turn. There is, of course, a provision for remembering which blocks have been scanned and avoiding infinite loops.
Once all pointers on the gray list have been scanned, every block of memory reachable by the kernel has been located.
the remaining white objects are considered orphan and reported via /sys/kernel/debug/kmemleak
Anything remaining on the white list is considered to be leaked, and the relevant information is sent back to user space.
Some allocated memory blocks have pointers stored in the kernel's internal data structures and they cannot be detected as orphans. To avoid this, kmemleak can also store the number of values pointing to an address inside the block address range that need to be found so that the block is not considered a leak. One example is __vmalloc().
5.2 Kmemleak API
include/linux/kmemleak.h

kmemleak_init        - initialize kmemleak
kmemleak_alloc       - notify of a memory block allocation
kmemleak_free        - notify of a memory block freeing
kmemleak_not_leak    - mark an object as not a leak.
kmemleak_ignore      - do not scan or report an object as leak
kmemleak_scan_area   - add scan areas inside a memory block
kmemleak_no_scan     - do not scan a memory block
kmemleak_erase       - erase an old value in a pointer variable
kmemleak_alloc_recursive   - as kmemleak_alloc but checks the recursiveness
kmemleak_free_recursive    - as kmemleak_free but checks the recursiveness
5.3 Steps to config Kmemleak
CONFIG_DEBUG_KMEMLEAK in "Kernel hacking" has to be enabled.
- make menuconfig
Kernel hacking --->
[ ] Kernel memory leak detector
(400) Maximum kmemleak early log entries
- Increase the config option "Maximum kmemleak early log entires" value to a sufficiently large number like 1200. The default value of 400 may not work correctly in all configurations.
CONFIG_DEBUG_KMEMLEAK=y
CONFIG_DEBUG_KMEMLEAK_EARLY_LOG_SIZE=1200
5.4 Usage
5.4.1 Install this newly configured kernel and reboot.
5.4.2 mount debugfs
Upon reboot, Check if your debugfs is mounted. Otherwise mount it.
# mount -t debugfs nodev /sys/kernel/debug/
If all is well, you should see a file kmemleak under your debugfs mounted location.
5.4.3 Display memleak
A kernel thread scans the memory every 10 minutes (by default) and prints the number of new unreferenced objects found.
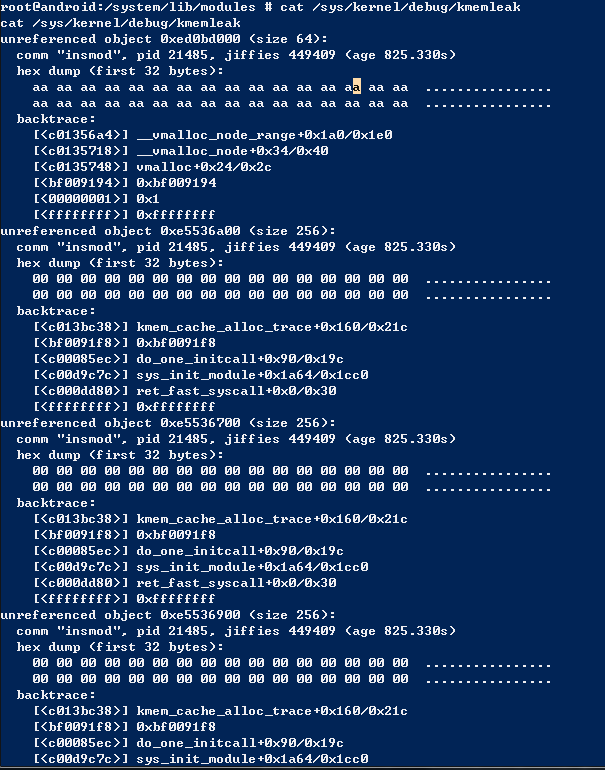
- To display the details of all the possible memory leaks:
# cat /sys/kernel/debug/kmemleak
- To trigger an intermediate memory scan:
# echo scan /sys/kernel/debug/kmemleak
- To clear the list of all current possible memory leaks:
# echo clear /sys/kernel/debug/kmemleak
New leaks will then come up upon reading /sys/kernel/debug/kmemleak again.
Note that the orphan objects are listed in the order they were allocated and one object at the beginning of the list may cause other subsequent objects to be reported as orphan.
5.4.4 Memory scanning parameters
Memory scanning parameters can be modified at run-time by writing to the/sys/kernel/debug/kmemleak.
The following parameters are supported:
off          - disable kmemleak (irreversible)
stack=on     - enable the task stacks scanning (default)
stack=off    - disable the tasks stacks scanning
scan=on      - start the automatic memory scanning thread (default)
scan=off     - stop the automatic memory scanning thread
scan=<secs>  - set the automatic memory scanning period in seconds(default 600[10 minutes], 0 to stop the automatic scanning)
scan         - trigger a memory scan
clear        - clear list of current memory leak suspects, done by marking all current reported unreferenced objects grey
dump=<addr>  - dump information about the object found at <addr>
Kmemleak can also be disabled at boot-time by passing "kmemleak=off" on the kernel command line.
Memory may be allocated or freed before kmemleak is initialised and these actions are stored in an early log buffer. The size of this buffer is configured via the CONFIG_DEBUG_KMEMLEAK_EARLY_LOG_SIZE(400->1200) option.
5.4.4 Testing
5.4.4.1 function test
- make an kernel module memory leak example
kzalloc/kmalloc/per_cpu on module init
  CONFIG_DEBUG_KMEMLEAK_TEST=m

  mm/kmemleak-test.c


   static int __init kmemleak_test_init(void)

    /*
     * Add elements to a list. They should only appear as orphan
     * after the module is removed.
     */
    for (i = 0; i < 10; i++) {
            elem = kzalloc(sizeof(*elem), GFP_KERNEL);
            pr_info("kmemleak: kzalloc(sizeof(*elem)) = %p\n", elem);
            if (!elem)
                    return -ENOMEM;
            INIT_LIST_HEAD(&elem->list);
            list_add_tail(&elem->list, &test_list);
    }

    for_each_possible_cpu(i) {
            per_cpu(kmemleak_test_pointer, i) = kmalloc(129, GFP_KERNEL);
            pr_info("kmemleak: kmalloc(129) = %p\n",
                    per_cpu(kmemleak_test_pointer, i));
    }
No free on module exit
  static void __exit kmemleak_test_exit(void)
  {
    struct test_node *elem, *tmp;

    /*
     * Remove the list elements without actually freeing the
     * memory.
     */
    list_for_each_entry_safe(elem, tmp, &test_list, list)
            list_del(&elem->list);
   }
- Module insmod and active init
 # insmod kmemleak-test.ko
 # echo clear /sys/kernel/debug/kmemleak
 # echo scan /sys/kernel/debug/kmemleak
 # cat /sys/kernel/debug/kmemleak
- Module rmmod and active exit
 # rmmod kmemleak-test
 # echo clear /sys/kernel/debug/kmemleak
 # echo scan /sys/kernel/debug/kmemleak
 # cat /sys/kernel/debug/kmemleak
5.4.4.2 Phone stress test
Long Run
  my $dev_op = "xxxx"
  my $clearcommand= "adb $dev_op shell \"echo clear > /sys/kernel/debug/   kmemleak"";
  my $scancommand="adb $dev_op shell \"echo scan > /sys/kernel/debug/  kmemleak"";
  my $readcommand="adb $dev_op shell \"cat /sys/kernel/debug/kmemleak"";
  my $adb_dfs = "adb $dev_op shell mount -t debugfs none /sys/kernel/debug";

  system($adb_dfs);
  while($i >=0 ){
      print "starting iteration $i\n";
      system($clearcommand);
      system($scancommand);
      system($readcommand);
      $i++;
      sleep(5);
  }
special Case
result example
unreferenced object 0xe51ba980 (size 128):
comm "kworker/0:2", pid 307, jiffies 4294937792 (age 335.690s)
 hex dump (first 32 bytes):
  00 c0 21 e6 00 10 00 00 00 00 00 00 00 00 00 00  ..!.............
  00 00 00 00 00 00 00 00 00 00 00 00 10 c3 37 c0  ..............7.
 backtrace:
   [<c013bc38>] kmem_cache_alloc_trace+0x160/0x21c
   [<c0378608>] usb_ept_alloc_req+0x2c/0xb8
   [<c037c5c8>] usb_diag_alloc_req+0x8c/0xdc
   [<c02cce64>] diagfwd_connect+0x28/0xd4
   [<c0379f1c>] usb_config_work_func+0x28/0xa0
   [<c00a9928>] process_one_work+0x27c/0x484
   [<c00a9d40>] worker_thread+0x210/0x3b0
   [<c00adbd8>] kthread+0x80/0x8c
   [<c000efa0>] kernel_thread_exit+0x0/0x8
   [<ffffffff>] 0xffffffff
5.4.5 Summary
- tracked regions/Functions
 kmalloc/kzalloc
 vmalloc
 kmem_cache_alloc
 per_cpu
- not tracked
Page allocations
ioremap
6 Summary
Linux kernel have already added memory leak detector- kmemleak
It could trace the memory objects from kmalloc, kzalloc,vmalloc, kmem_cache_alloc,per_cpu etc.
Linux dynamic memory management.
- alloc big space: alloc_pages/free_page:buddy algorithm(not tracked)
- alloc data struct::kmalloc/kfree:slab algorithm(tracked)
- Non continuous memory area:Vmalloc/Vfree(tracked)
7 Reference
... Documentation/kmemleak.txt